Group analysis from a photo
Photograph a target, calibrate it to real-world scale, mark your shots, and the Groups page measures the group and tells you how far your zero is off — in MIL and MOA.
Take a usable photo
- Shoot the target square-on, camera parallel to the paper, filling most of the frame.
- Make sure something of known size is visible — a ruler, the grid squares on the target, a coin, or the target’s printed dimensions.
- Even lighting, no glare. A phone camera is fine.
On the Groups page, use File to pick an existing photo or Camera to take one now.
The four things you set on the image
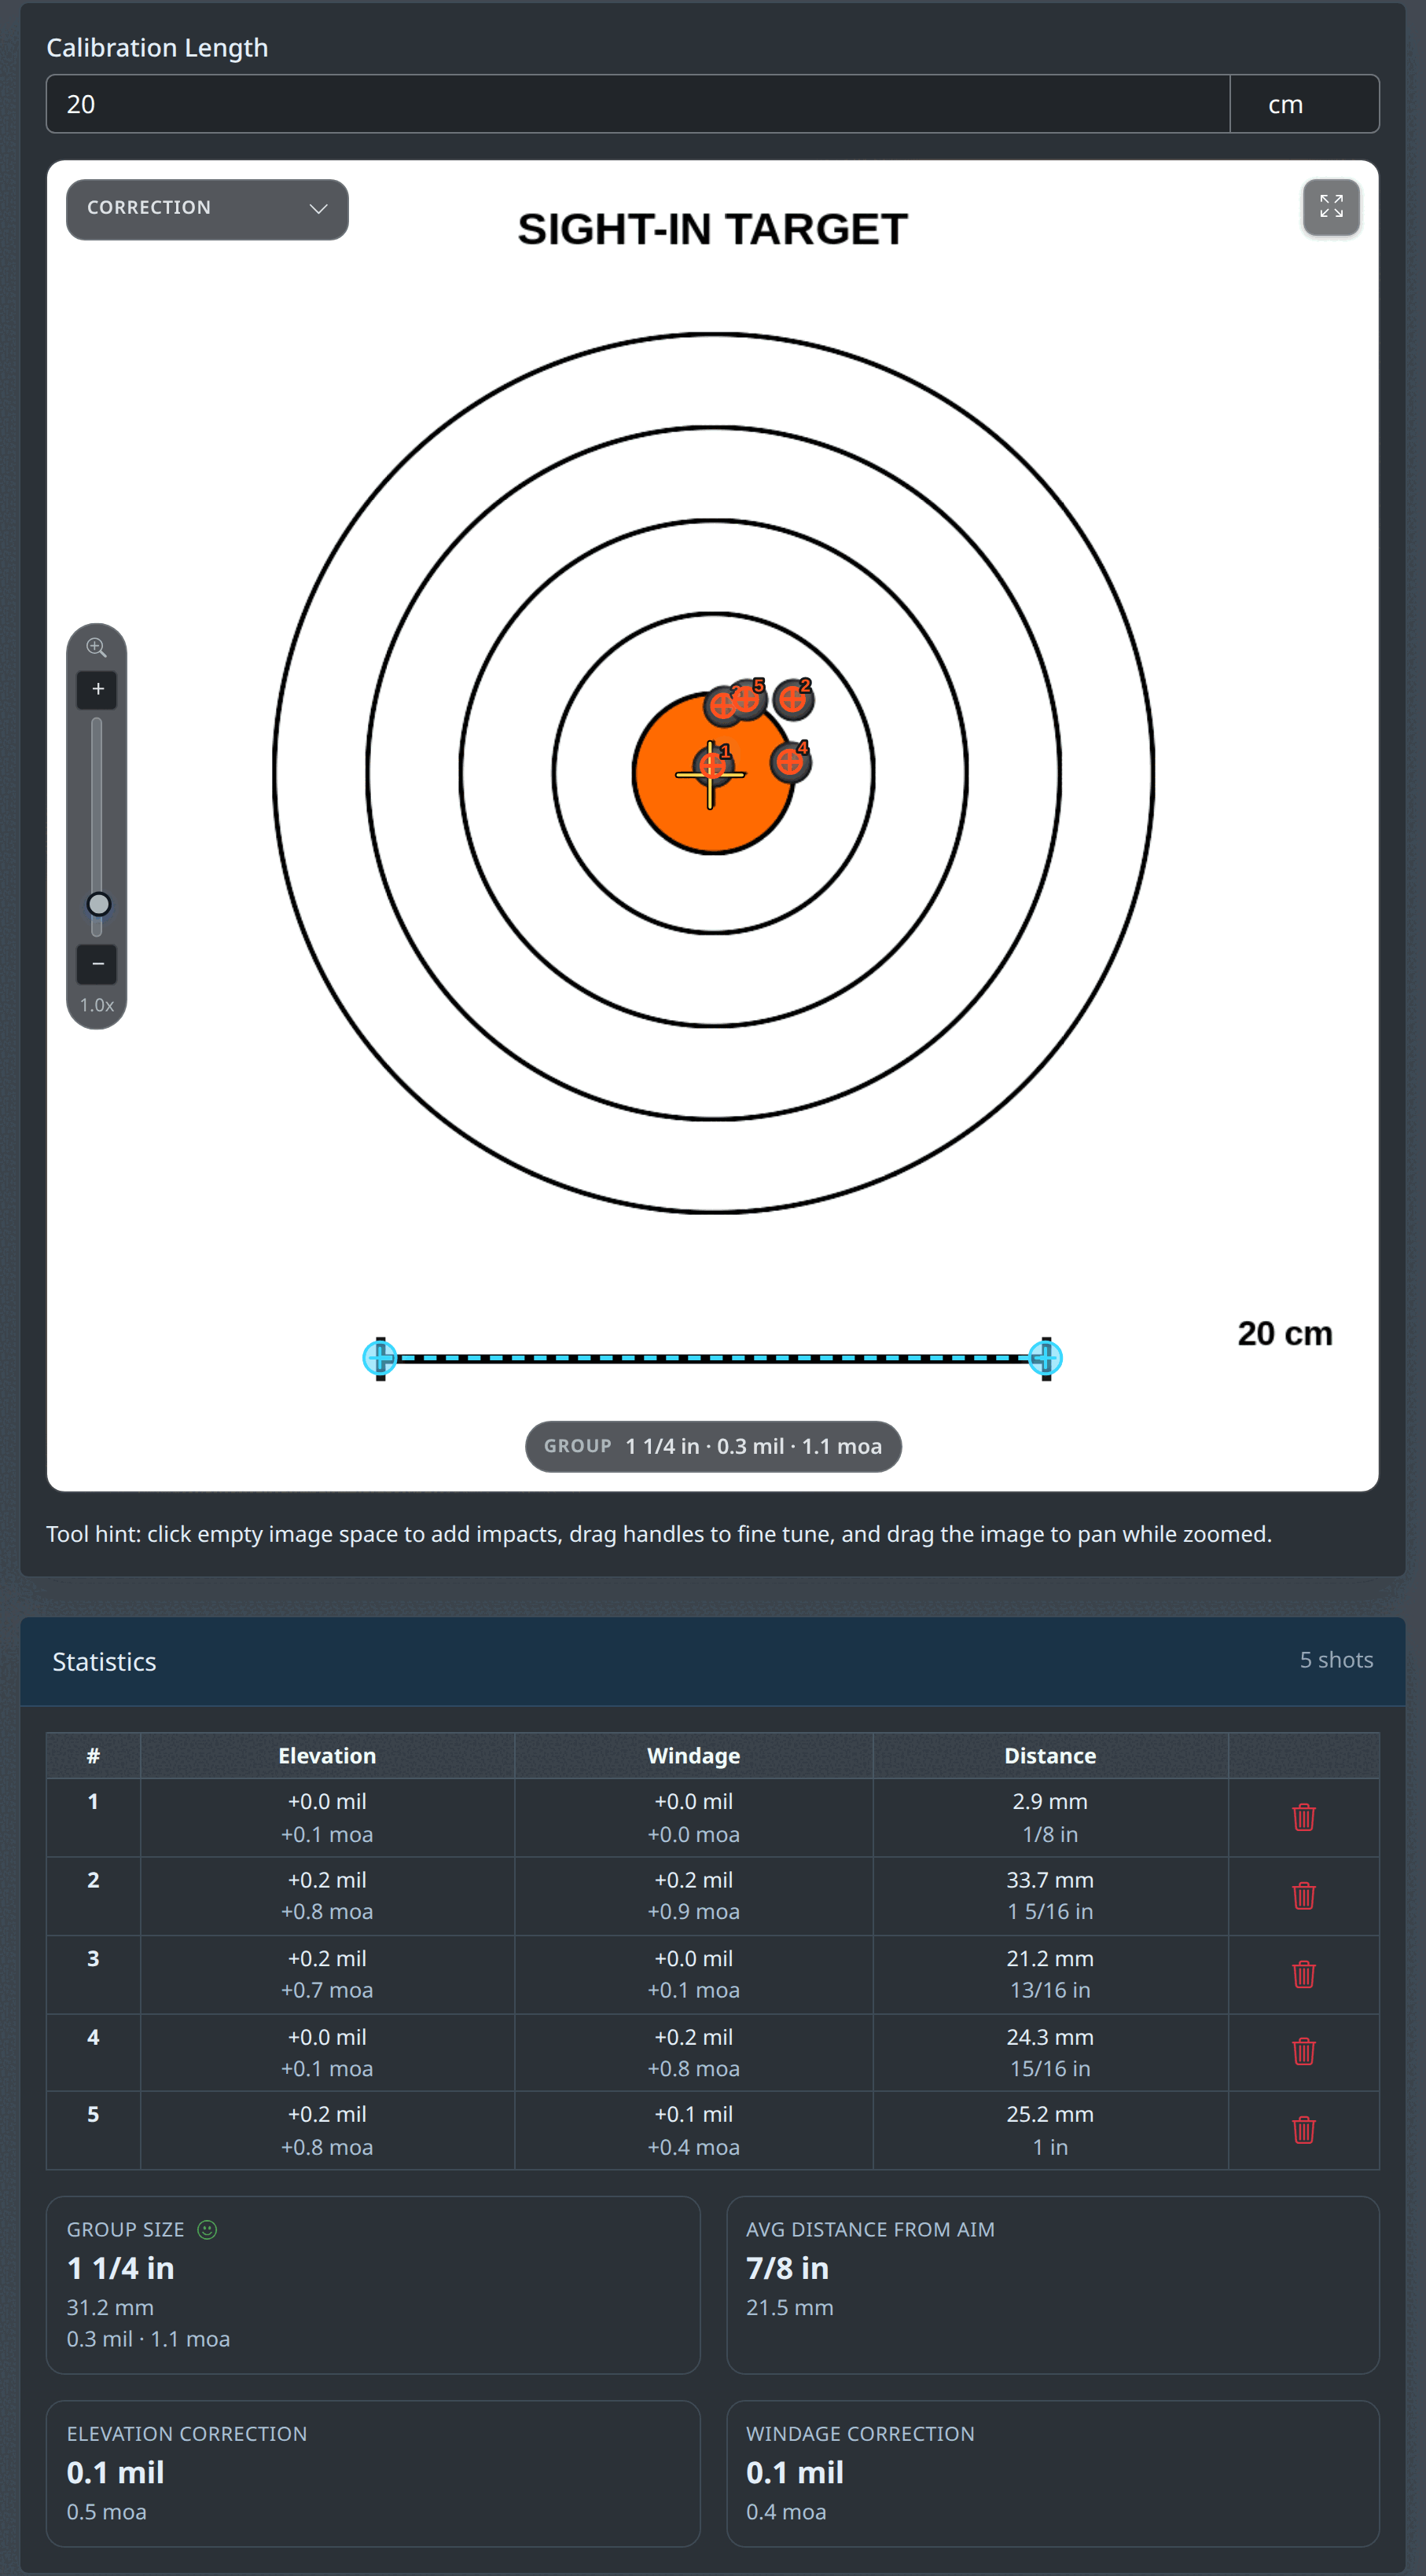
1. Calibration — the scale
On the Scale step, drag the two ends of the calibration line onto a feature whose real length you know, then type that length into Calibration Length and pick the unit. In the screenshot the line spans a 20 cm scale bar. Everything downstream depends on this being accurate, so zoom in and place the endpoints carefully.
2. Calibre — the shot size
Set your bullet diameter so the shot markers are drawn to the right size. Or choose a saved card under Linked Range Card and the calibre is taken from it automatically.
3. Aim point — where you were aiming
On the Aim step, tap your point of aim to move the crosshair there, or drag the marker. The zero correction is measured from here to the centre of your group.
4. Shots
On the Shots step, click an empty part of the image to drop a shot marker; drag any marker to nudge it onto the centre of the hole. Markers are numbered in the order you place them. Remove a shot from its row in the statistics table.
Photo taken at a slight angle? A new photo opens on the Straighten step: drag the four handles onto the corners of the target, or of the sheet it is printed on, and use Preview to check it came out square. This removes the perspective distortion that would otherwise skew your measurements.
Reading the statistics
Precision — how tight the group is
| Group Size | The largest centre-to-centre distance between any two shots (extreme spread). Shown in mm/in and, once Range is set, in MIL and MOA. This is the number most people quote, but with only 3–5 shots it is noisy — one flyer changes it completely. |
|---|---|
| Avg Distance From Aim | The mean distance of each shot from your aim point (mean radius). It settles down faster than extreme spread across small groups, so it is a better like-for-like comparison between loads. |
Zero — how far off you are
Set Range to the distance you shot at, then the Elevation Correction and Windage Correction values appear. They are the angular offset from your aim point to the centre of your group.
- Positive elevation means the group printed high; positive windage means it printed right.
- To bring your point of impact onto your point of aim, dial the opposite sense — a group 0.3 mil high and 0.2 mil right needs 0.3 mil down and 0.2 mil left.
- The per-shot table breaks the same elevation/windage offset out for every individual impact.
- No correction is shown without a range — an angle needs a distance to be meaningful.
Don’t chase a bad group. If the group is larger than your rifle’s usual performance, fix the group before adjusting zero — a correction built on a 2 MOA group that should be 0.7 MOA is mostly noise.
Saving and linking
- Save keeps the analysis (with its photo) in your browser for later comparison.
- Share creates a link containing the whole analysis.
- From the Logbook , a shot string can link to a saved group analysis so your velocity data and your group data for that string live together.